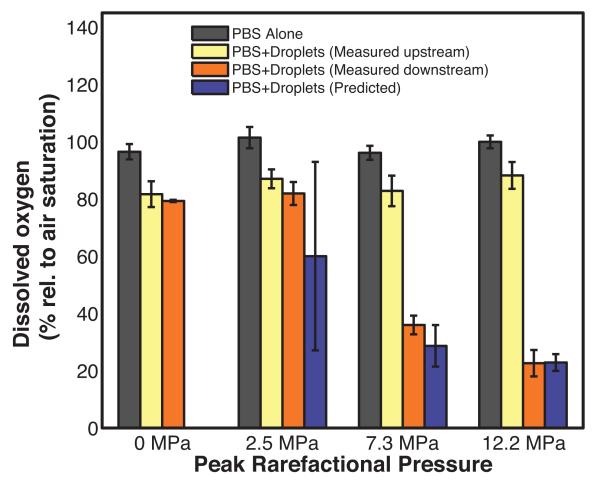
Figure 4. Dissolved oxygen of fluids exposed to different insonation pressures.
Percent dissolved oxygen (DO) relative to air-saturated phosphate buffered saline (PBS) measured in the absence of droplets (black bars), measured upstream of the insonation region in the presence of non-centrifuged droplets (yellow bars), and measured downstream of the insonation in the presence of non-centrifuged droplets (orange bars) as a function of the ultrasound peak rarefactional pressure. Error bars indicate the standard deviation of three measurements. The violet bars indicate the predicted DO after ultrasound exposure of non-centrifuged droplets. The predicted DO values are not statistically different from the DO measured downstream of the insonation region. Error bars indicate the propagated error based on the standard deviations from Fig 3a and equation 6.

