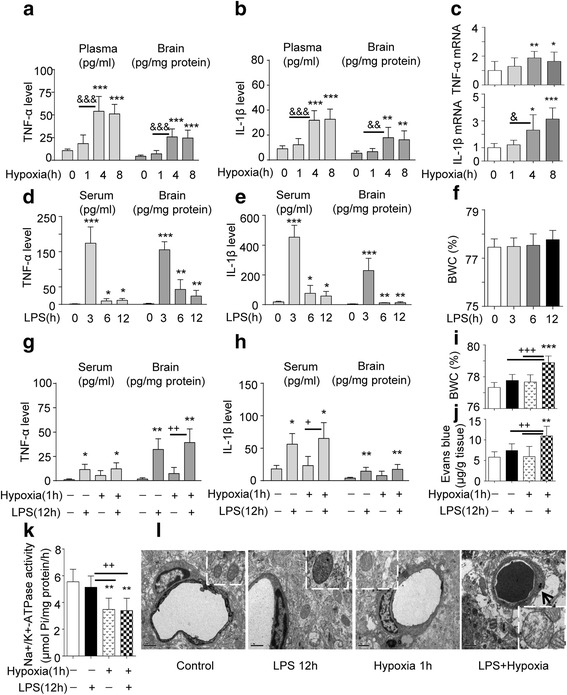
Fig. 2.

Systemic inflammation facilitates the onset of brain edema under transient hypoxia. a, b TNF-α and IL-1β level in serum and in brain cortex of rats were tested after hypoxia exposure (1–8 h) and increased after 4 h. c Hypoxia-increased TNF-α and IL-1β mRNA expression in brain cortex (n = 6). *P < 0.05; **P < 0.01; ***P < 0.001 compared with control. & P < 0.05; & & P < 0.01; &&& P < 0.001 (4 h hypoxia vs 1 h hypoxia). d, e TNF-α and IL-1β levels in serum and cortex of rats were measured by ELISA and increased, following the LPS treatments indicated (n = 6). *P < 0.05; **P < 0.01; ***P < 0.001 compared with control. f Brain water content (BWC) was determined by wet/dry weight ratio at the time points indicated after LPS treatment (n = 6–12). g, h TNF-α and IL-1β levels in serum and cortex of rats were measured by ELISA and increased, following LPS or hypoxia alone or combination of both treatments indicated (n = 6). *P < 0.05; **P < 0.01; compared with control. + P < 0.05; ++ P < 0.01, hypoxia + LPS vs hypoxia. i BWC was determined by wet/dry weight ratio after LPS, hypoxia or both (n = 6–12), ***P < 0.001 compared with control, +++ P < 0.001, compared with LPS or hypoxia alone. j BBB permeability was determined by detecting the extravasations of Evans blue dye (n = 8). **P < 0.01 compared with control, ++ P < 0.001, compared with LPS or hypoxia alone. k Na+/K+-ATPase activity in brain cortex was measured following the indicated treatments (n = 6). **P < 0.01 compared with control, ++ P < 0.01, compared with hypoxia or hypoxia + LPS. All data are presented as mean ± SD. l Representative transmission electron micrographs of perivascular astrocytes and mitochondria. Scale bar, 1 μm, arrow indicates enlarged astrocyte foot processes
