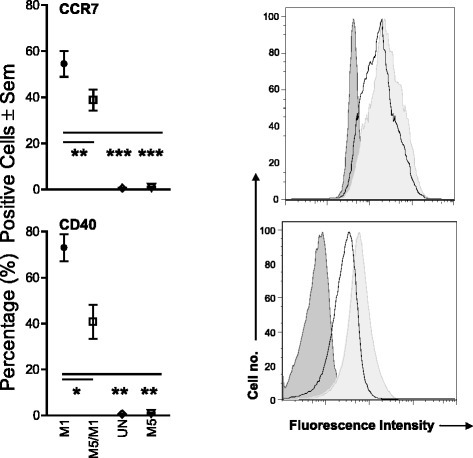
Fig. 2.

Effect of M. leprae on M1 surface marker expression. CD14+ cells were seeded in 24-well plates at the concentration of 5x10⁵/well and polarized (M1), or exposed to M. leprae at MOI 5:1 for 5 h prior to polarization (Lep5/M1). Additional conditions included stimulation of monocytes with M. leprae at MOI 5:1 (Lep5) and cells in culture medium alone without stimulation (UN). Changes in the percentages of CCR7+ and CD40+ cells were evaluated. A two-tail paired Student’s t-test was used for the analysis. Results are representative of 6 experiments (6 individual donors); Histogram of one representative experiment. Dark gray: unstimulated cells; light gray: M1 cells; black line: Lep5/M1. *P ≤ 0.05; **P ≤ 0.001; ***P ≤ 0.0001
