Fig. 3.
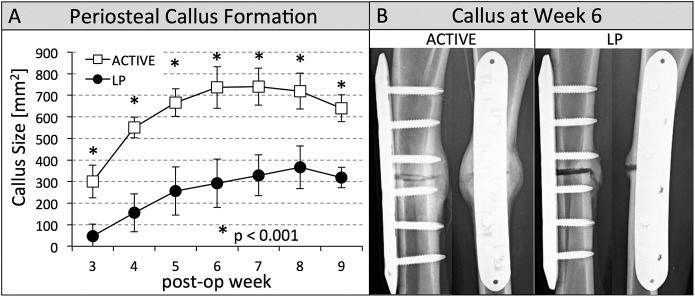
Figs. 3-A and 3-B Periosteal callus formation and callus at postoperative week 6 for both groups. Fig. 3-A Progression of periosteal callus formation. The active locking plate (ACTIVE) group developed significantly more callus (p < 0.001), indicated by asterisks, than the standard locking plate (LP) group at each time point from postoperative weeks 3 through 9. The error bars indicate the standard deviation. Fig. 3-B By week 6, all visible cortices had bridged in the ACTIVE group, but only 50% of these cortices had bridged in the LP group, as shown in two representative specimens.

