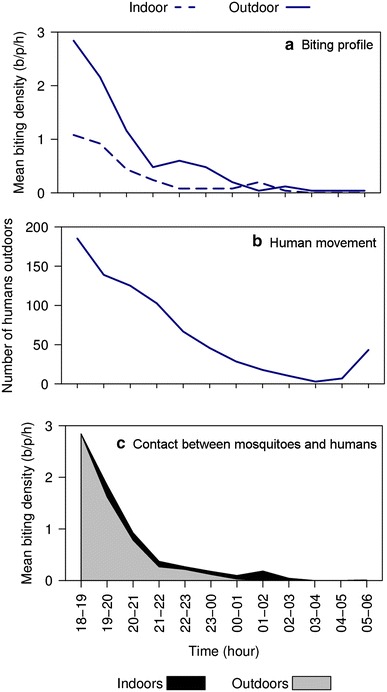
Fig. 2.

The hourly indoor and outdoor profile of Anopheles farauti biting (a) and the number of humans outside of houses throughout the night (b) in Haleta village, Central Province, Solomon Islands. The stacked line graph (c) is the estimated contact between humans and mosquitoes, which considers the movement pattern of people by weighting the indoor and outdoor biting rates throughout the night by the proportion of humans that are typically indoors or outdoors at each time period [41, 42]. Note b/p/h = bites/person/hour
