
Fig. 5.
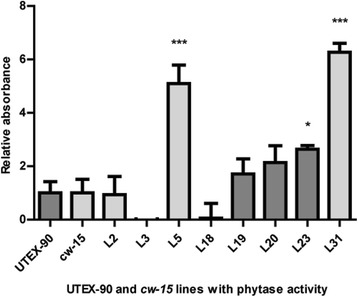
Determination of phytase activity of transformed UTEX-90 and cw15 lines; Phytase activity determination of transformed lines of UTEX-90 (dark grey; control, L18, L19, L20 and L23) and cw15 (light grey; control, L2, L3, L5 and L31) strains. The phytase levels are represented as fold-change relative to the mock control lacking lyophilized microalgae. Asterisks indicate significant differences (n = 6 ± SEM; *: 0.05 > p > 0.01; ***: p < 0.001; all analysis compared to the mock control)