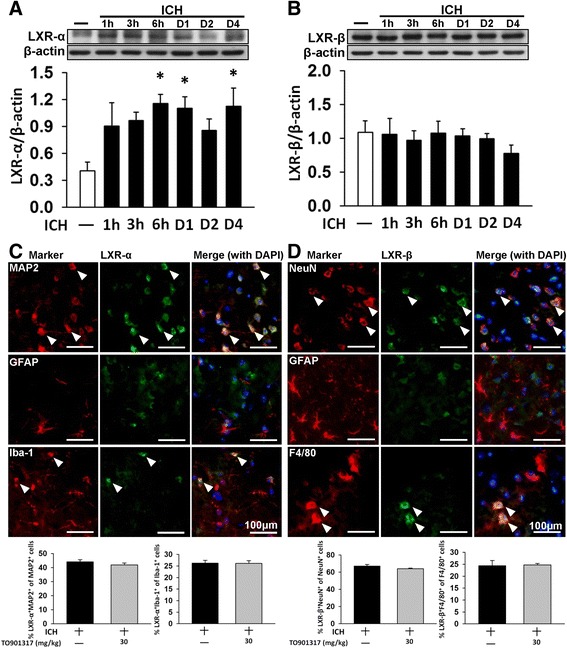
Fig. 2.

Expression and cellular distribution of LXR-α and LXR-β receptor isoforms in mouse brains subjected to ICH. Representative immunoblots and quantitative data of a the LXR-α and b LXR-β protein levels in the ipsilateral (hemorrhagic) hemispheres from ICH or sham-operated mice after collagenase injection. Bar graphs of densitometric analysis of bands show a significant increase in LXR-α protein levels in the ipsilateral hemispheres of ICH mice at 6 h, 1 day, and 4 days post-ICH, compared with the sham-operated mice. LXR-β expression remained unaffected after ICH. Values are mean ± SEM; * P < 0.05 versus sham group (n = 7 mice/group, one-way ANOVA). c LXR-α and d LXR-β in the peri-hematomal area observed by immunofluorescence labeling. LXRs are shown in green, and immunolabeling of MAP 2 or NeuN (neurons), Iba-1 or F4/80 (microglia), or GFAP (astrocytes) is shown in red. Yellow labeling (white arrows) indicates co-localization. Both LXR-α and LXR-β were mainly expressed in neurons and microglia and rarely in astrocytes. Sections were stained with DAPI (blue) to show all nuclei. The scale bar is 100 μm. Values are mean ± SEM (n = 6 mice/group, Student’s t test)
