
Fig. 6.
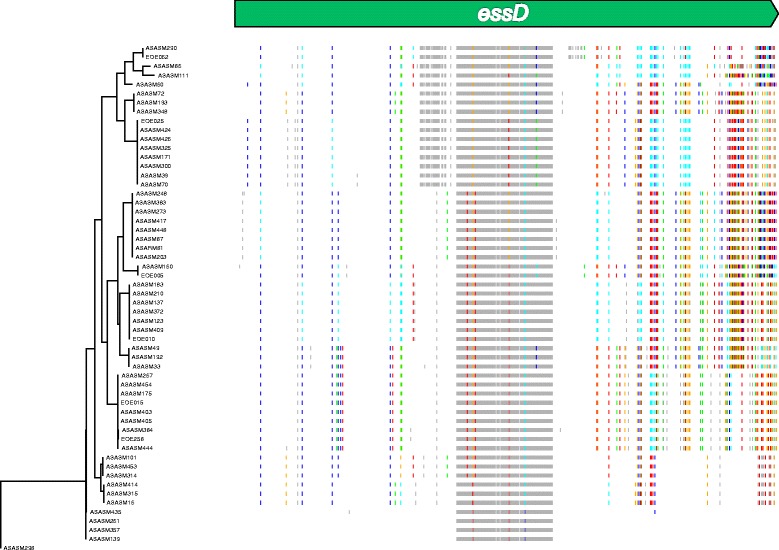
Evidence of recombination in the essD gene. On the left is a maximum likelihood phylogeny constructed with essD gene sequences from isolates containing the essC1 subtype. To the right, each vertical colored line represents a SNP position in the essD sequence, top. Colored vertical lines along the tracks represent bases that differ from the ancestral sequence: grey = non-homoplastic change; colored lines represent homoplastic bases: red = A, blue = T, green = C, orange = G. The pattern of lines provide a barcode of essD similarity between strains and identifies regions containing homoplasies that are incongruent with the phylogeny and are associated with recombination