
Fig. 1.
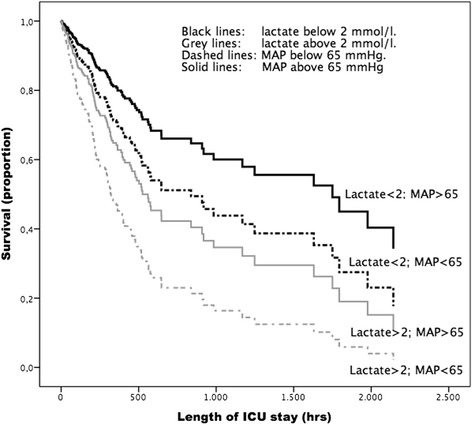
Cox regression model for ICU survival based on the four categories for mean 24-hour values of lactate and MAP. –2Log-likelihood = 1524; Chi-sqare 32, p = 0.001 between groups. ICU intensive care unit, MAP mean arterial pressure
Official websites use .gov
A
.gov website belongs to an official
government organization in the United States.
Secure .gov websites use HTTPS
A lock (
) or https:// means you've safely
connected to the .gov website. Share sensitive
information only on official, secure websites.
Cox regression model for ICU survival based on the four categories for mean 24-hour values of lactate and MAP. –2Log-likelihood = 1524; Chi-sqare 32, p = 0.001 between groups. ICU intensive care unit, MAP mean arterial pressure