
Fig. 4.
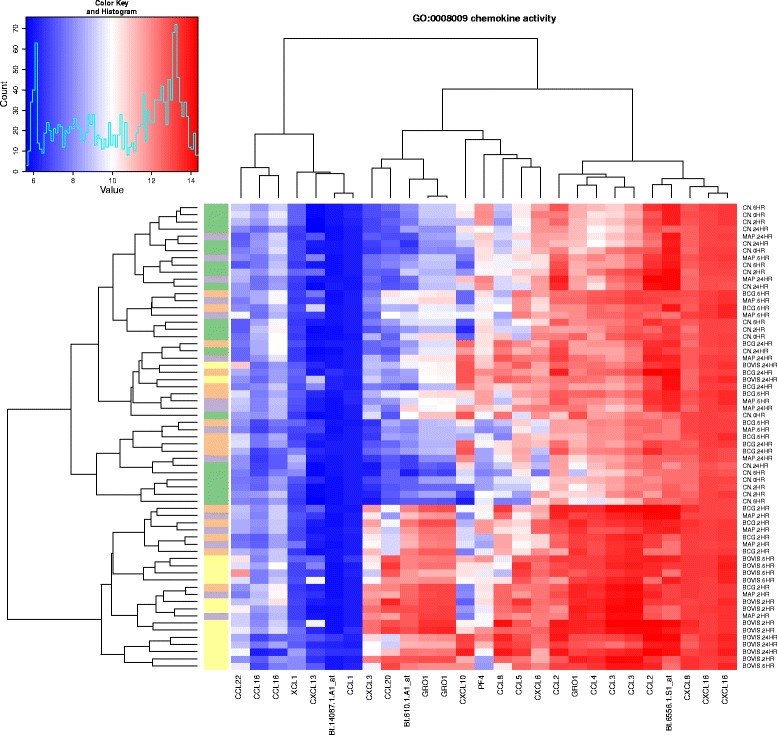
Heat map and hierarchical clustering of treatment groups using expression data from genes associated with the top-ranked GO term. The heatmap_GO visualisation function summarises expression level for all genes present in the ExpressionSet and associated with chemokine activity (GO:0008009). Green: uninfected MDM; purple: M. avium subspecies paratuberculosis; orange: M. bovis BCG; yellow: M. bovis