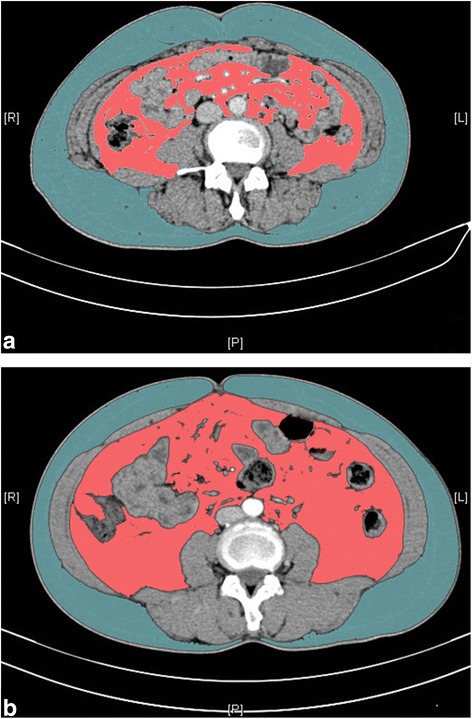
Fig. 2.

Measurements of visceral (Pink color) and subcutaneous (blue color) adipose tissue on computerized tomography images. a/b represents different body fat distribution: both patients’ body mass index is 24.7 kg/m2, while the visceral adipose tissue percentage (VAT%) is 30.3 % (a) and 56.95 % (b), respectively
