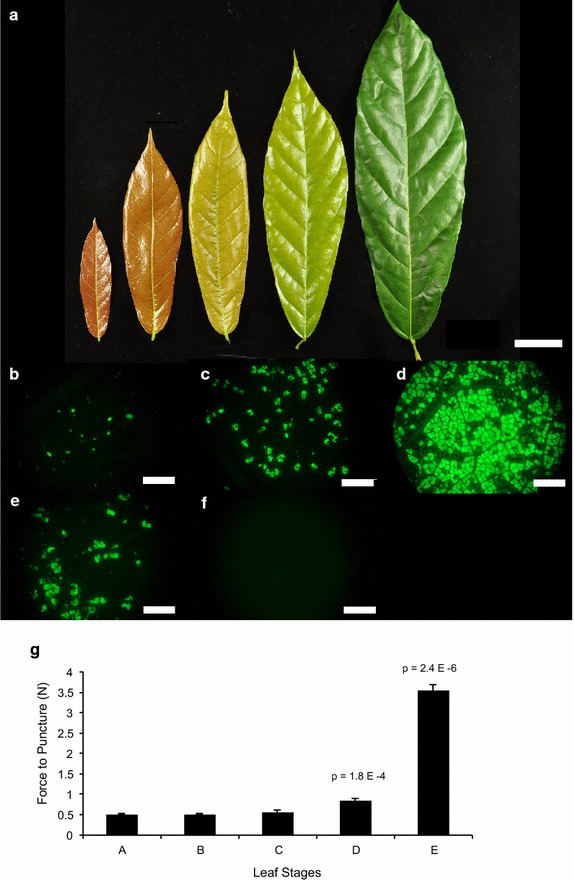
Fig. 2.

Leaf stages and force to puncture measurements. a Photograph displaying representative leaves of stages A (leftmost) to E (rightmost) collected from genotype Scavina 6. Scale bar represents 5 cm. b–f Representative photographs of EGFP fluorescence taken 48 h after infiltration of leaves (stages A–E) with Agrobacterium. Scale bars represent 1 mm. g Measurement of force to puncture for each leaf stage. Bars represent mean of five measurements, each representing one leaf from that stage. Bars represent standard deviation across five replicates. T test p values are shown above bars for Stage D and Stage E, which are comparisons of measurements of Stage C leaves with those of the older stages. Differences between Stage A and C and B and C were not significant
