
Fig. 5.
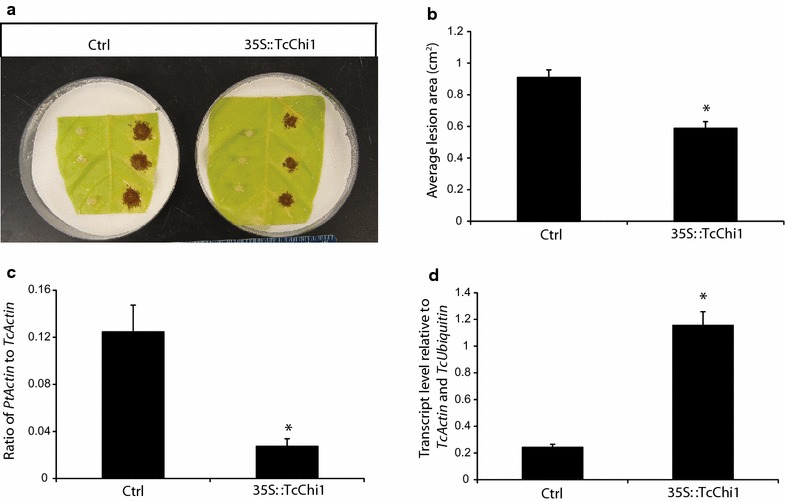
Functional analysis of TcChi1. a Representative images of lesions from control (Ctrl, transformed with pGH00.0126) and leaves transiently transformed to overexpress TcChi1 2 days after Phytophthora tropicalis inoculation. Scale bar represents 1 cm. b Average lesion areas from control and TcChi1 overexpressing leaves were measured 3 days after inoculation using ImageJ. Bar charts represent the mean ± SE of measurements from 12 lesion spots from four leaf discs of each genotype. c Pathogen biomass was measured at the lesion sites by qPCR to determine the ratio of pathogen DNA to cacao DNA 2 days after inoculation. Bar charts represent four biological replicates, each with three technical replicates. d qRT-PCR analysis of TcChi1 transcript 2 days after vacuum infiltration. Data represent mean ± SE of three biological replicates. The asterisks denote a significant difference determined by single factor ANOVA analysis (p < 0.05)