
Fig. 6.
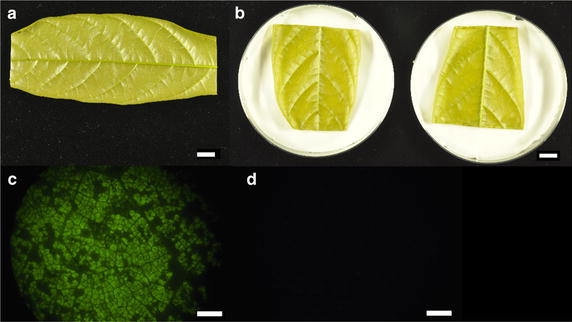
Images representing stages in leaf transformation process. a Stage C cacao leaf with tip and base removed. Scale bar represents 1 cm. b Two halves of a cacao leaf placed into petri dishes with wet paper towel and filter paper. Scale bar represents 1 cm. c Ideal EGFP coverage seen 48 h after vacuum infiltration of leaves with Agrobacterium. Scale bar represents 1 mm. d Photograph of untransformed leaf tissue using GFP filter. Scale bar represents 1 cm