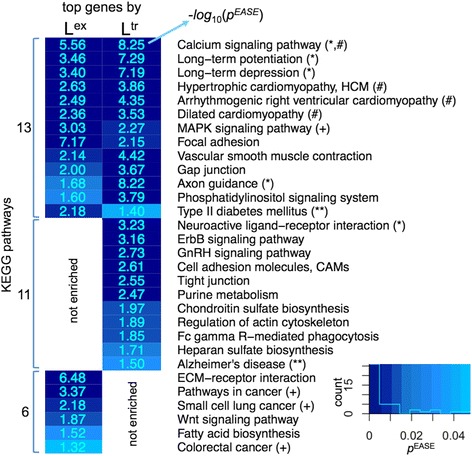
Fig. 4.

The KEGG pathway enrichment analysis for the top genes by Lex summed exon and Ltr transcript lengths. Accounted for are the genes that have the Lex or Ltr metrics (considered separately) greater than the median by twice the standard deviation. The significantly enriched KEGG pathways are revealed via DAVID gene functional annotation server, taking Homo sapiens as a correction background. The outcomes are presented as a heatmap, grouped by the presence/absence in both Lex and Ltr categories, with individual rows ranked by the lowest significance score in {Lex, Ltr} pair for each row. The p EASE significance scores for the enrichment are shown in a -log 10 scale (−log 10 p EASE > 1.301 means p EASE < 0.05), with the original distribution histogram and colour coding shown at the lower-right corner. The notations in the brackets mark the pathways linked to cancer (+), neurological (*), cardiological (#) and other (**) multigenic pathological conditions. The full list of genes that appear in each enriched pathway can be found in Additional file 3
