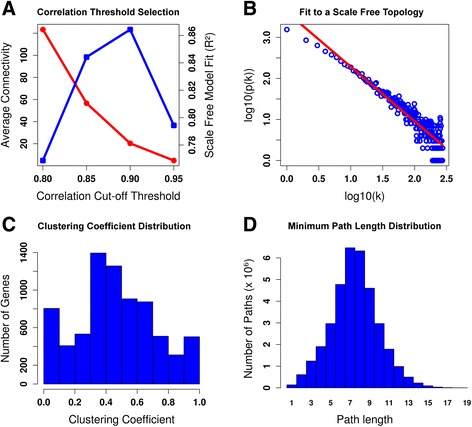
Fig. 1.

Network Construction and Topology Analysis. a Correlation Threshold Selection. The blue line shows that at the absolute value of correlation 0.90 the scale-free model fit exhibits a maximum. The red line shows that for increasing correlation thresholds the average connectivity of the network decreases, nonetheless for 0.90 it still presents a high value. According to this, the correlation threshold used to generate ChlamyNET was fixed to 0.90. b The degree distribution of a scale-free network follows an exponential negative distribution. The scale-free topology fit of ChlamyNET was computed using linear regression over the logarithmic transform of its degree distribution. c The clustering coefficient of a node or gene represents the degree of co-expression or correlation between its neighbours. Genes with a high clustering coefficient posses a high degree of co-expression or coordination among its co-expressed genes. ChlamyNET exhibits the high average clustering coefficient of 0.66. d ChlamyNET constitutes a small world network, that is a scale-free network with a high clustering coefficient. This is reflected in the fact that the average minimal path length between genes is 7.5
