
Fig. 4.
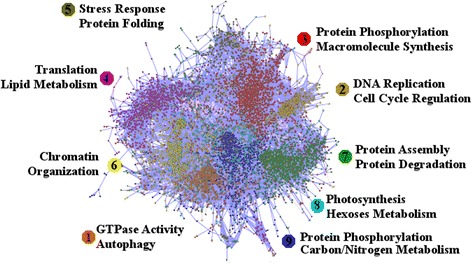
ChlamyNET Clustering and Cluster Functional Annotation. In ChlamyNET each node specifies a gene and an edge between genes represents that the corresponding gene expression profiles exhibit an absolute Pearson correlation coefficient value greater than 0.90. Therefore, edges represent co-expression relationships. Blue edges stand for positive correlation whereas pink edges stand for negative values. The nine different gene clusters are identified by numbers and different colours corresponding to the code in Fig. 3. Clusters are also annotated with the biological processes where the corresponding genes are potentially involved in