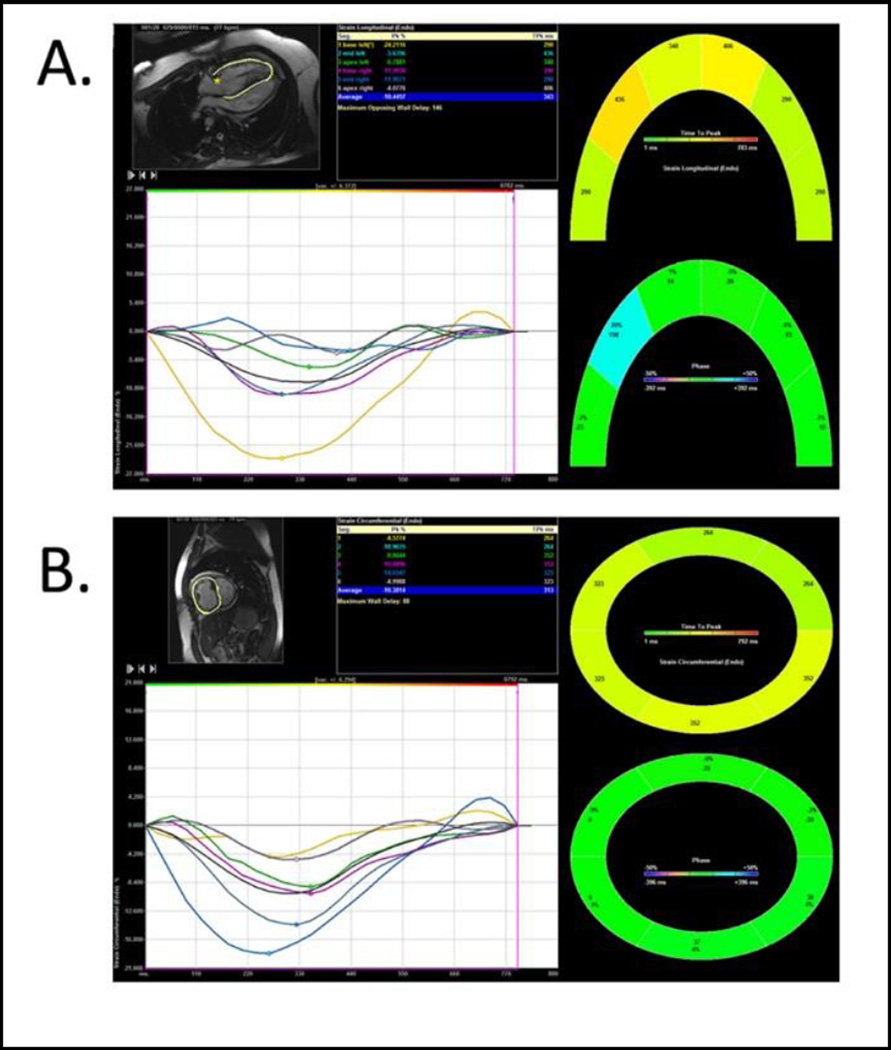
Fig 1.
Myocardial segmental deformation tracings using VVI software. Longitudinal (4-chamber) Strain (A); and Circumferential (short-axis) Strain (B) The tables in the figure show segmental, peak strain and average peak global strain. The image is color coded for graphical display of segmental and regional velocity. The grayscale image show the endocardial tracing in the 4-chamber and short-axis view.

