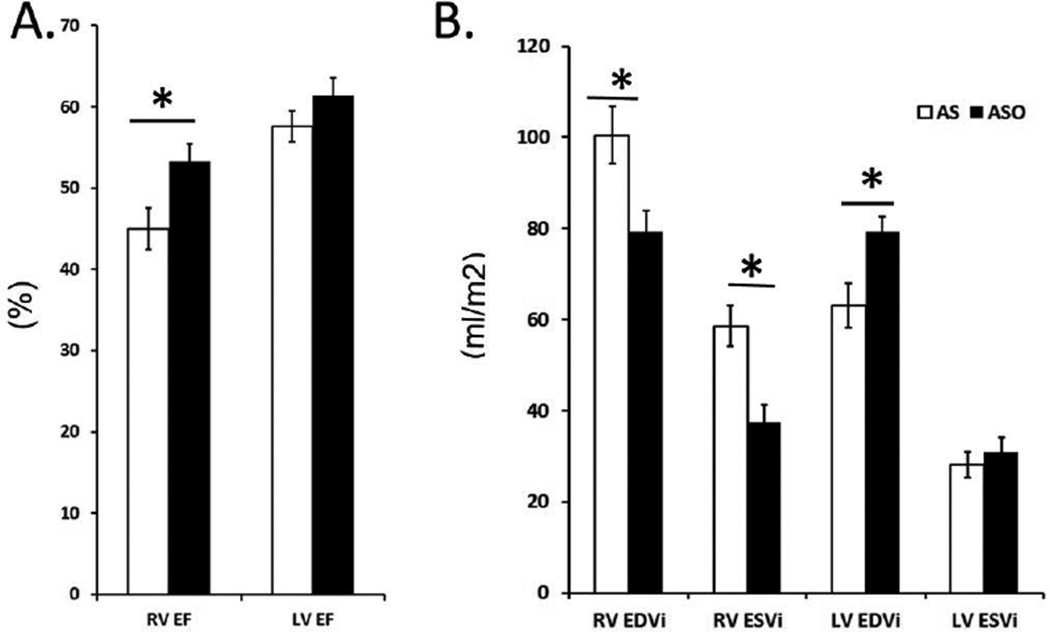
Fig 2.
Comparison of Right Ventricle (RV) and Left Ventricle (LV) Function and Volume between the Atrial Switch (AS) and Arterial Switch (ASO) group. (*) indicates statistical significance with p values ≤ 0.05. (A) Bar graphs represent significantly decreased RV Ejection Fraction in the AS group. (B) The RV end-diastolic and end-systolic volumes normalized to BSA are significantly increased in the AS group.

