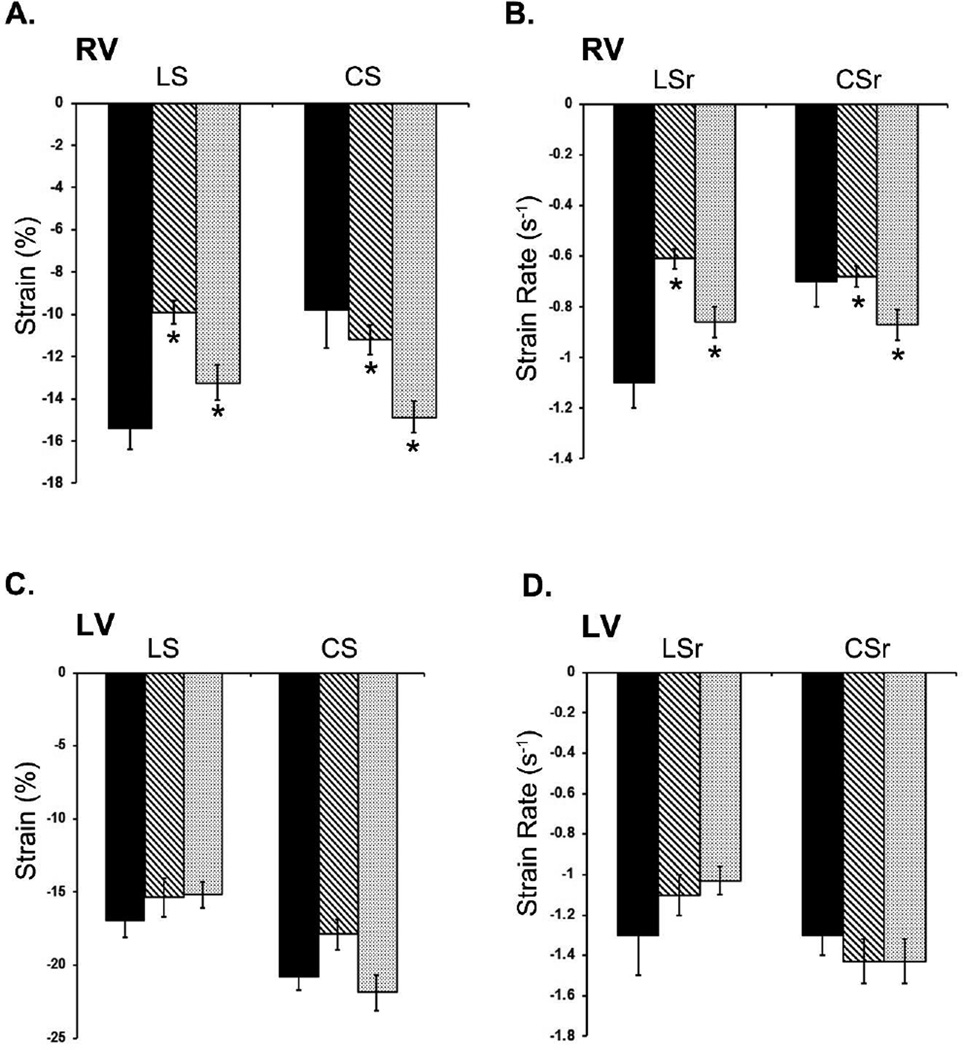
Fig 3.
Changes in Right Ventricle (RV) and Left Ventricle (LV) Strain and strain rate between the atrial switch (AS) and the arterial switch (ASO) groups compared to controls. (*) indicates statistical significance with p values ≤ 0.05. Bar graphs show significant decrease in RV longitudinal strain (LS), longitudinal strain rate (LSr) in the AS group (A, B). The circumferential strain (CS) and circumferential strain rate (CSr) is increased in both the AS and ASO group compared to controls (A, B) LV strain and strain rates were not significantly changed in either the AS and ASO groups (C, D).

