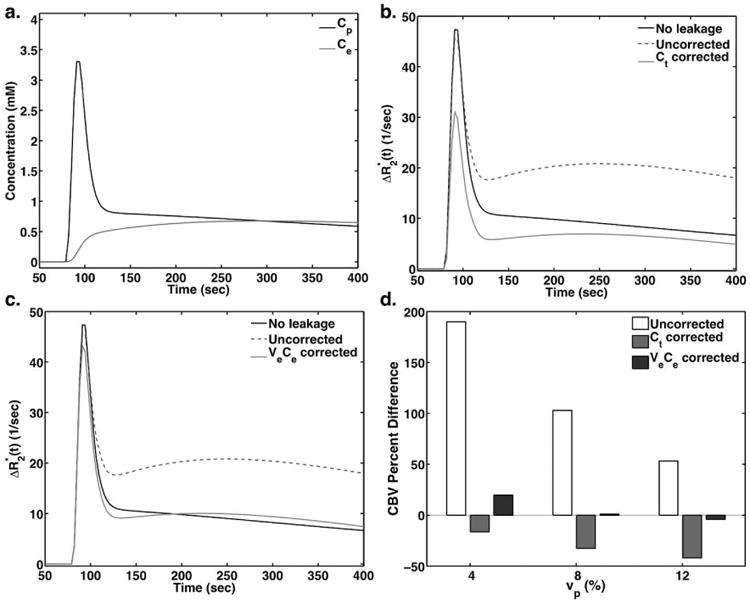
Figure 1.

(a) Simulated Cp and Ce curves for an 8% vascular volume fraction and 60% cell volume fraction using a two-compartment model and PFM. (b-c) Simulated ΔR2* curves for no leakage, uncorrected, and corrected using (b, Method 2) and (c, Method 3). (d) Bar plots showing the CBV percent difference between the true CBV and the uncorrected and corrected CBV.
