Figure 6.

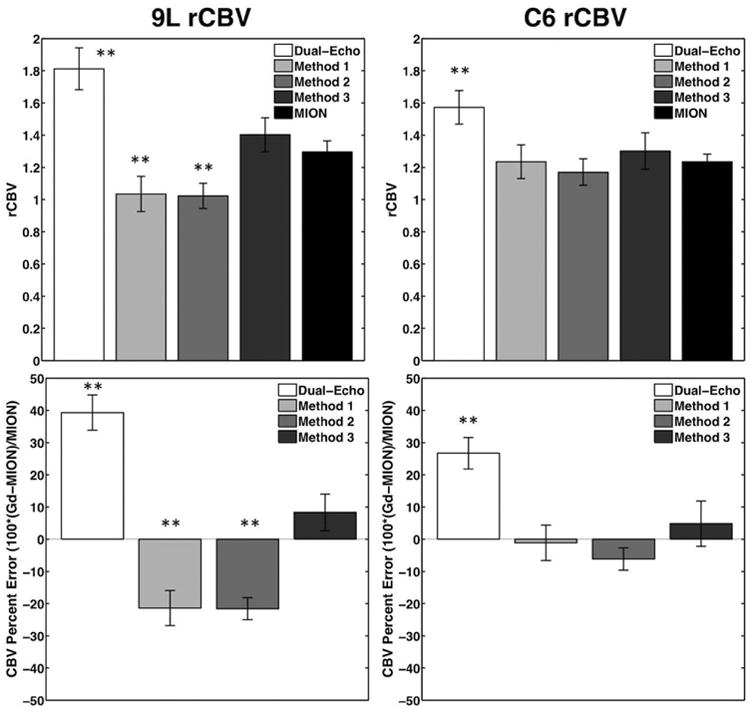
Bar plots showing mean rCBV and CBV percent error in 9L (n=12) and C6 (n=9) tumors for T1-corrected dual-echo, Methods 1, 2 and 3 (T1- and T2*-corrected), and MION reference. **p<0.01 and *p<0.05.

Bar plots showing mean rCBV and CBV percent error in 9L (n=12) and C6 (n=9) tumors for T1-corrected dual-echo, Methods 1, 2 and 3 (T1- and T2*-corrected), and MION reference. **p<0.01 and *p<0.05.