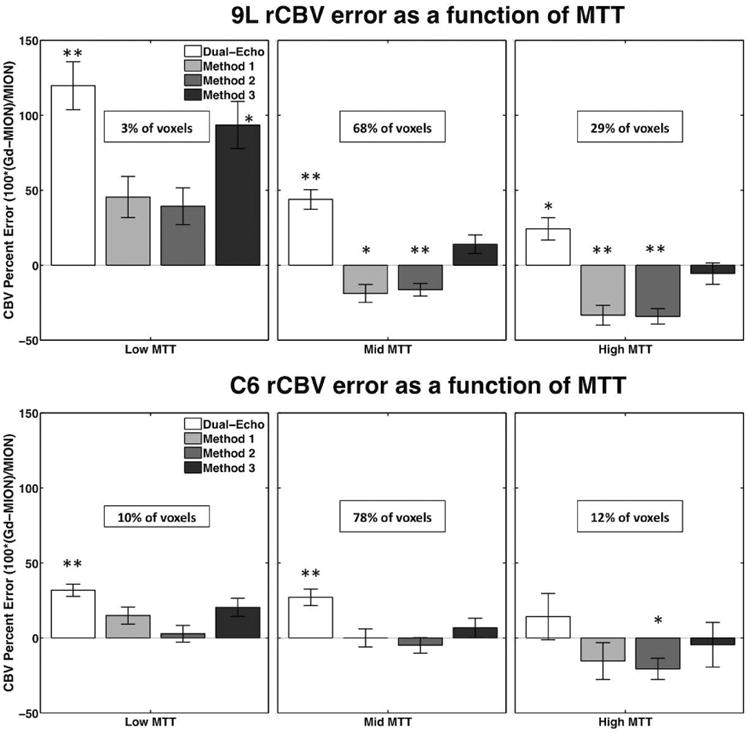
Figure 8.

Bar plots showing rCBV percent error (relative to MION rCBV) in 9L and C6 tumors as a function of MTT for dual-echo and Methods 1, 2, and 3. The percents of all voxels described by each bin (low, mid, and high MTT) are shown in each panel. **p<0.01 and *p<0.05.
