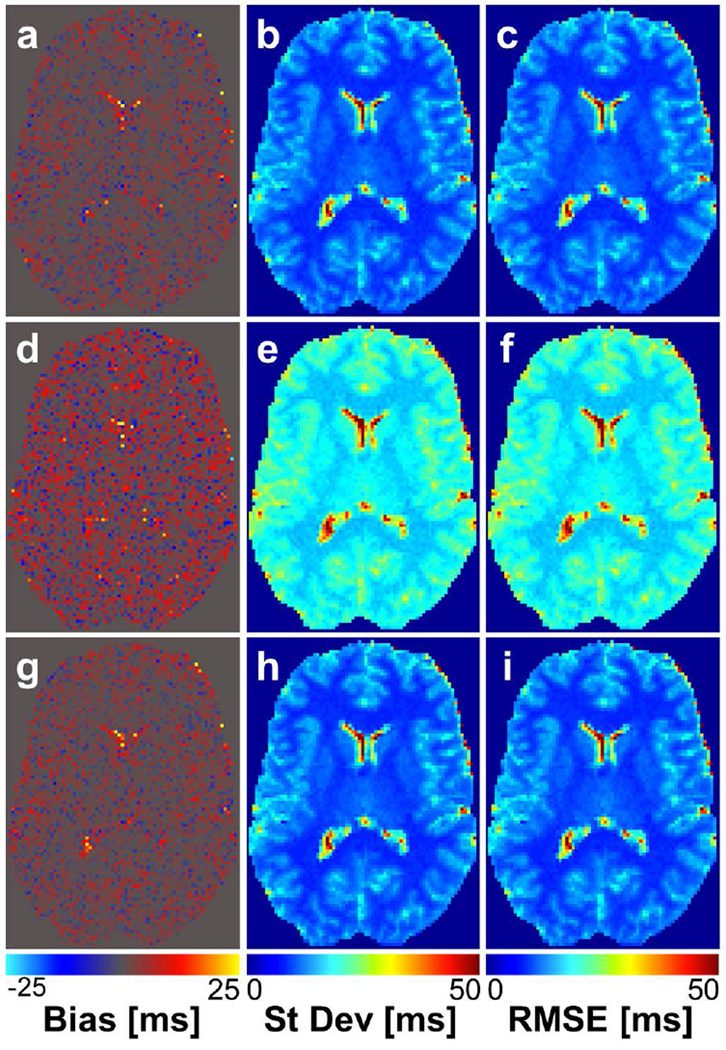
FIG. 2.
T1 bias (a, d, g), standard deviation (b, e, h), and RMSE (c, f, i) maps based on simulations of T1 mapping in the human brain using 10-angle acquisitions at SNR = 20. a–c correspond to simulation results using the 10 angles selected with our proposed method; d–f correspond to results using the 10-point range angle set; g–i correspond to results using a the 10-point repeat set. All measurements are in units of ms.

