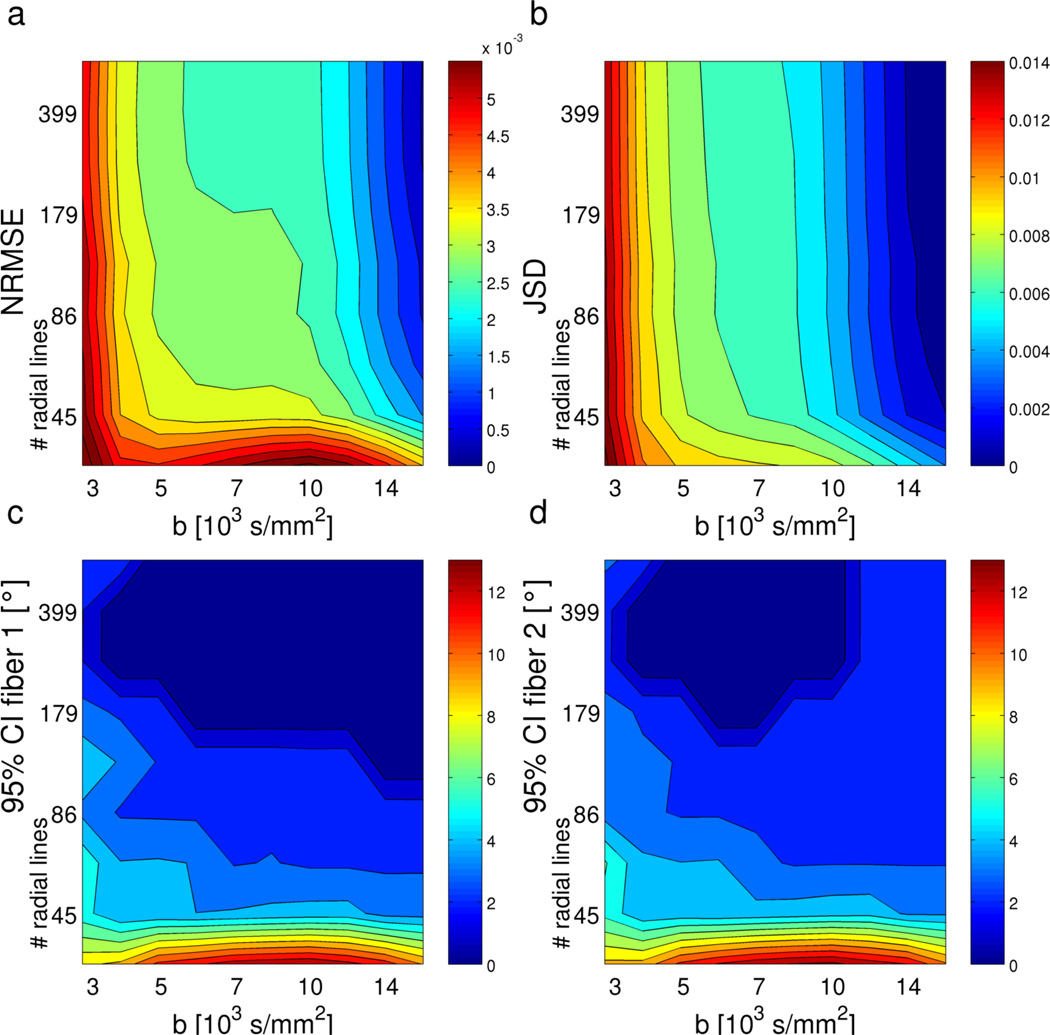
Figure 5.
Simulated RDSI reconstruction performance of two crossing fibers (angle 60°) at different b-values (number of shells nshell = b-values/1000) and with different numbers of radial lines Nl (10000 simulated ODFs per sampling scheme). The reconstruction performance is indicated by the mean normalized RMSE error (NRMSE) and the mean Jensen-Shannon divergence (JSD) of the ODFs relative to the highest b-value simulation, and the 95% confidence intervals (CI) of the identified first and second fiber directions. (SNR = 33).

