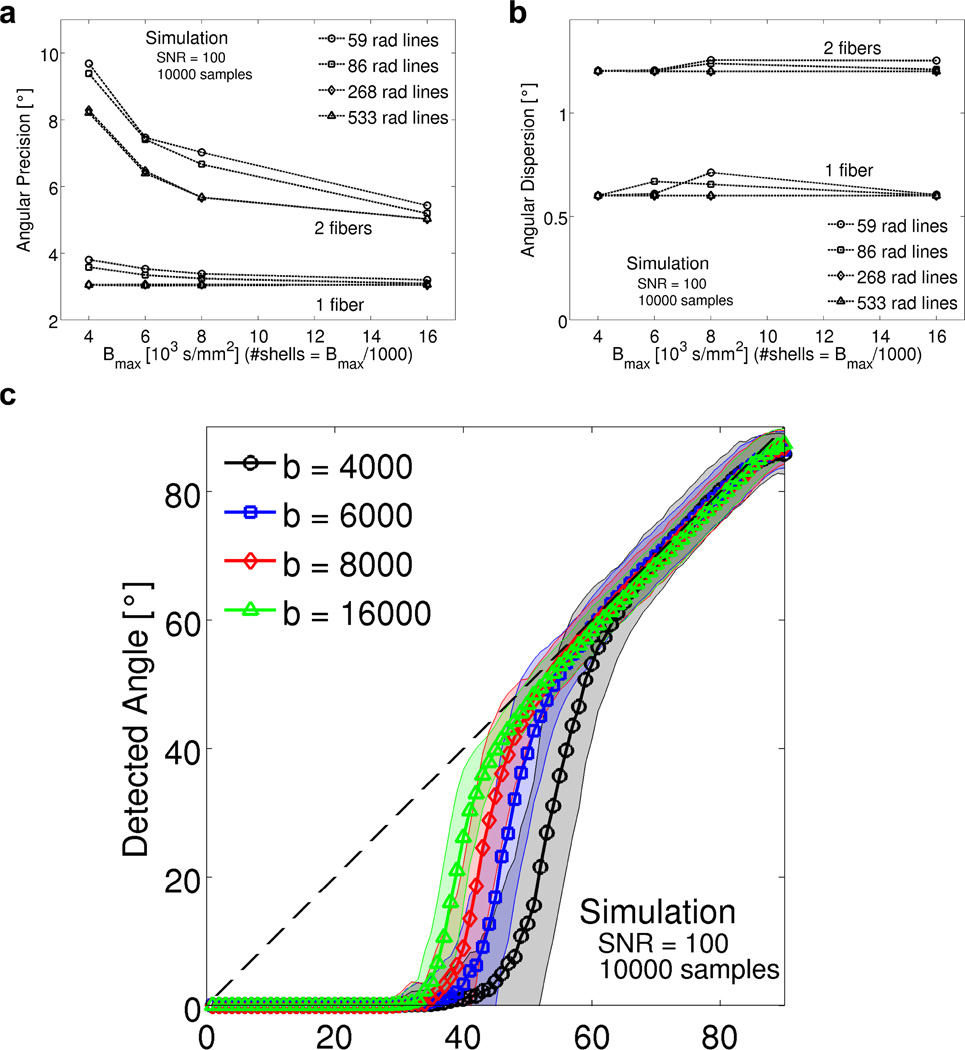
Figure 6.
a) Angular precision and b) angular dispersion of simulated RDSI reconstructions of one and two fibers (random angle) as a function of the b-values (number of shells nshell = b-values/1000) and number of radial lines Nl used. c) Detected versus simulated crossing fiber angle for 10000 randomly oriented pairs of fibers; the solid line indicates the mean detected angle at each simulated angle, whilst the interval indicates the standard deviation. (SNR = 100).

