Fig. 3.
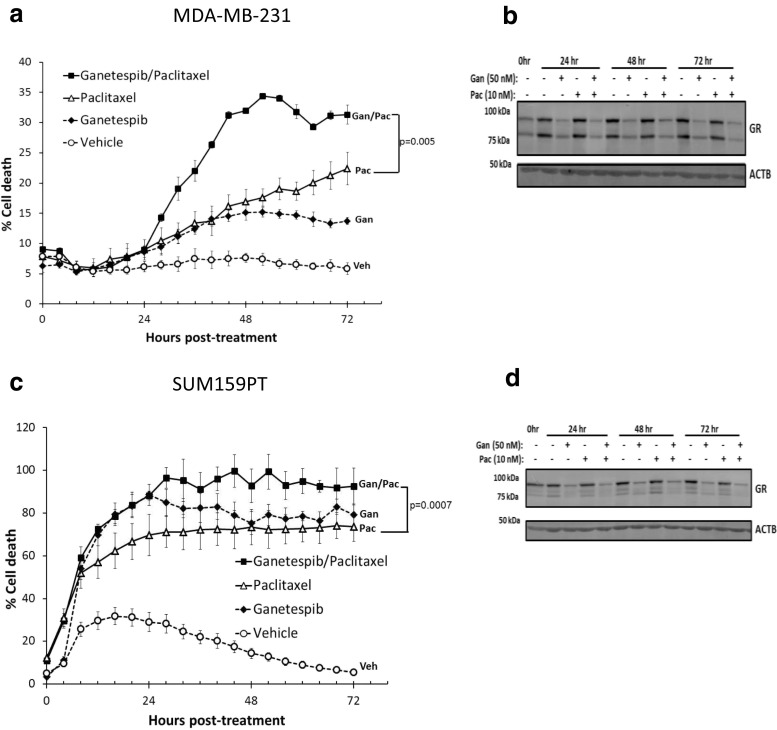
Hsp90 inhibition sensitizes TNBC cell lines to paclitaxel-induced cell death and results in GR depletion. a IncuCyte live cell imaging of MDA-MB-231 cell death over 72 h. YOYO-1 fluorescent staining was used to monitor cell death, and ImageJ software was used to analyze percentage cell death [YOYO-1 positive (fluorescent)/total cell number (phase contrast)]. This figure is representative of two independent experiments. The error bars represent the SEM of three cell culture wells. A comparison of cell death following ganetespib (Gan)/paclitaxel (Pac) vs. Pac demonstrates a significant increase in cell death with the addition of Gan (p = 0.005). In both cases, the statistics were done by a mixed effect ANOVA based on two independent experiments. b Time course of Western blot following a treatment of cells with Gan (50 nM) ± Pac (10 nM) that were cultured in parallel to cells in Fig. 3a. c, d The results using the same conditions as in Fig. 3a, b respectively, except SUM159PT cells were used instead. The comparison of percentage cell death following Gan/Pac treatment is again significantly higher compared to Pac alone (p = 0.0007)

