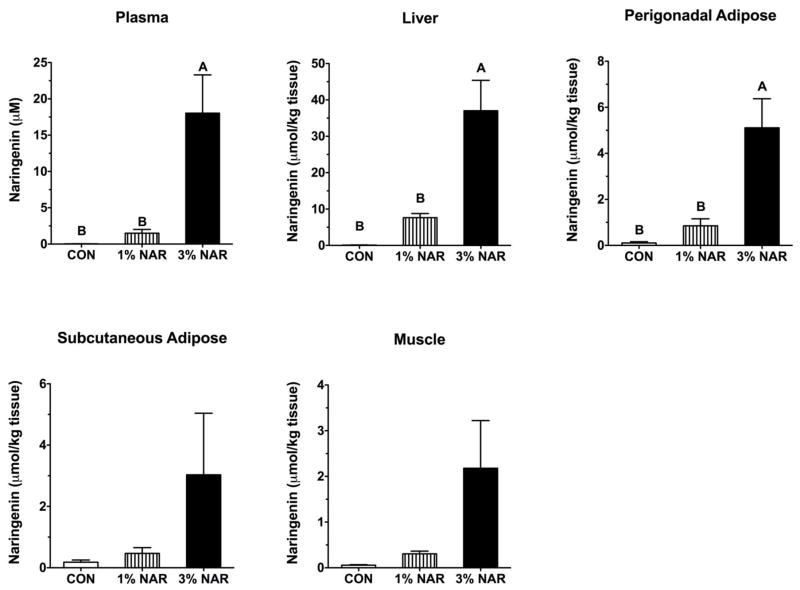
Figure 1. Naringenin accumulation in plasma and tissues after 11 weeks of supplementation.
OVX C57BL/6J mice were fed a high-fat diet for 6 weeks and switched to the high-fat diet with 0%, 1%, and 3% wt/wt naringenin. After 11 weeks of the diets, total naringenin concentrations were 5–12 times higher in plasma (n=4/group) or tissue samples (n=5/group) of mice fed 3% naringenin than the levels in mice fed 1% naringenin. Values are presented as mean ± SEM. Data were analyzed using one-way ANOVA with post hoc Tukey’s test. Significant difference (P < 0.05) between groups with different mean superscripts.

