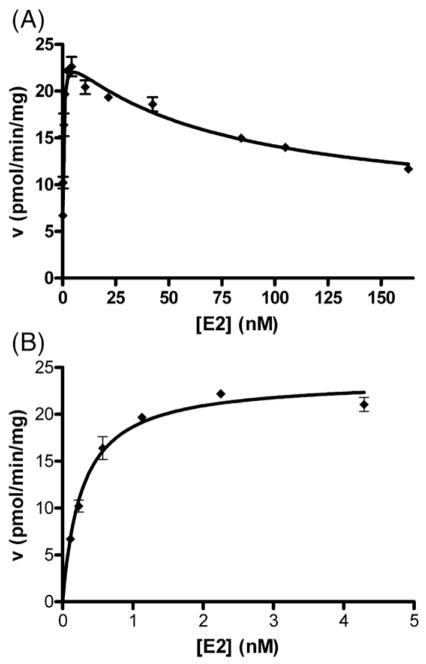
Fig. 3.
Kinetics of estradiol sulfonation in sheep placental cytosol. Results shown are from one sample. Similar results were obtained with two other individuals. Part A shows rates of estradiol-3-sulfate formation over a wide range of estradiol concentrations: the line indicates the fit of the data to a model of partial substrate inhibition (see Materials and methods section). Part B shows an expanded view of the low substrate concentration range: the line was obtained by fitting the data to the Michaelis–Menten equation.

