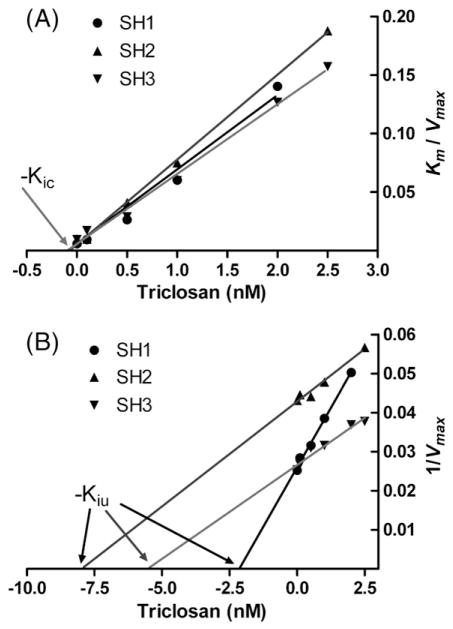
Fig. 4.
Inhibition plots for the effect of Triclosan on estradiol sulfonation in 3 individual sheep placental cytosol samples. Part (A) shows the plot of appKm/appVmax against the concentration of Triclosan present. The intercepts on the x axis show the values for −Kic, the constant for competitive inhibition. Part (B) shows the plot of 1/appVmax against the concentration of Triclosan. The intercepts on the x axis show the values for −Kiu, the constant for inhibitor binding to the enzyme-substrate complex.

