
Fig. 5.
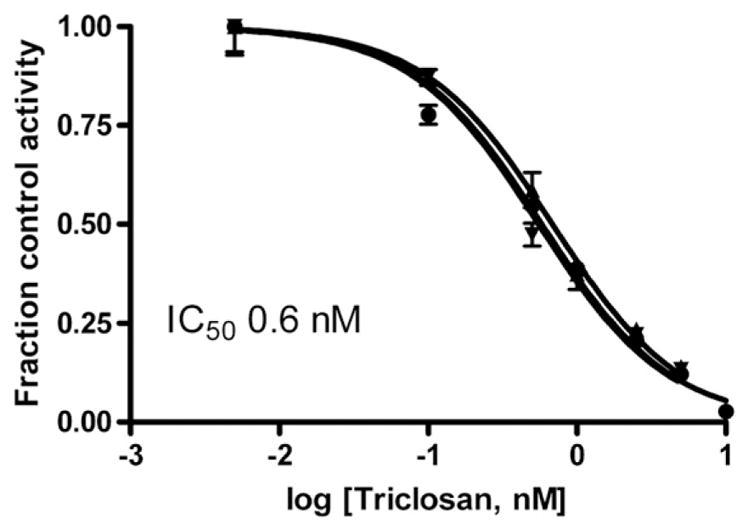
Inhibition of estrone sulfonation in sheep placental samples, measured at 2 nM estrone, by various concentrations of Triclosan. The lines shown are the fits of fraction control activity versus log [Triclosan] to sigmoidal dose–response curves for each of 3 individuals. Error bars on each line indicate the S.D. of assay replicates at each concentration of Triclosan. The mean IC50 value is indicated on the graph.