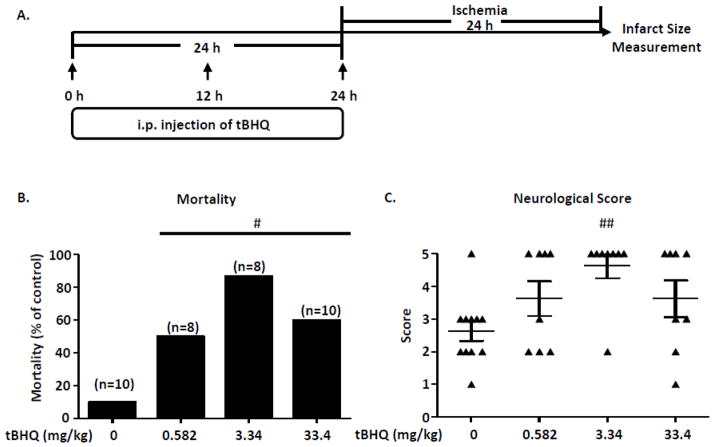
Figure 1. Pre-ischemic treatment with tBHQ increases mortality and does not improve neurological score in the murine pMCAO model.
(A). Schematic diagram summarizing the injection and stroke timeline. The short arrows represent time points of tBHQ injection. (B). Mortality after 24 hr pMCAO. Vehicle, n=11, tBHQ 0.582 mg/kg, n=8, tBHQ 3.34 mg/kg, n=8, tBHQ 33.4 mg/kg, n=10. (C). Neurological score after pMCAO. Data are expressed as mean ± SD. Vehicle, n=11, tBHQ 0.582 mg/kg, n=8, tBHQ 3.34 mg/kg, n=8, tBHQ 33.4 mg/kg, n=8. One-way ANOVA followed by post hoc Tukey test and Chi-Square test were used for multiple group comparison. #P < 0.05, ##P < 0.01 compared to vehicle.

