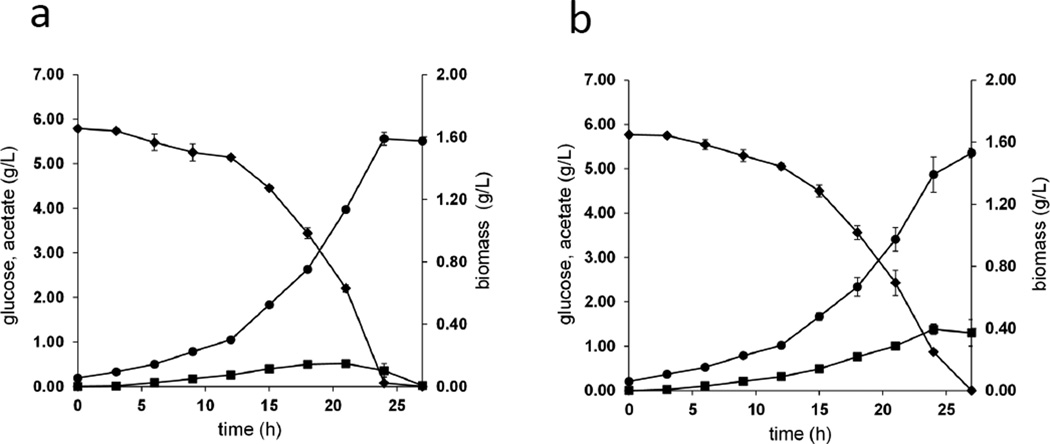
Fig. 2.
Growth curves for the double mutants with different order of gene deletions a) E. coli ΔApgi1 ΔaceA2 and b) E. coli ΔaceA1 Δpgi2. The symbol • represents biomass, ♦ represents glucose concentration, and ■ represents acetate concentration. The error bars represent standard deviation for three replicates.

