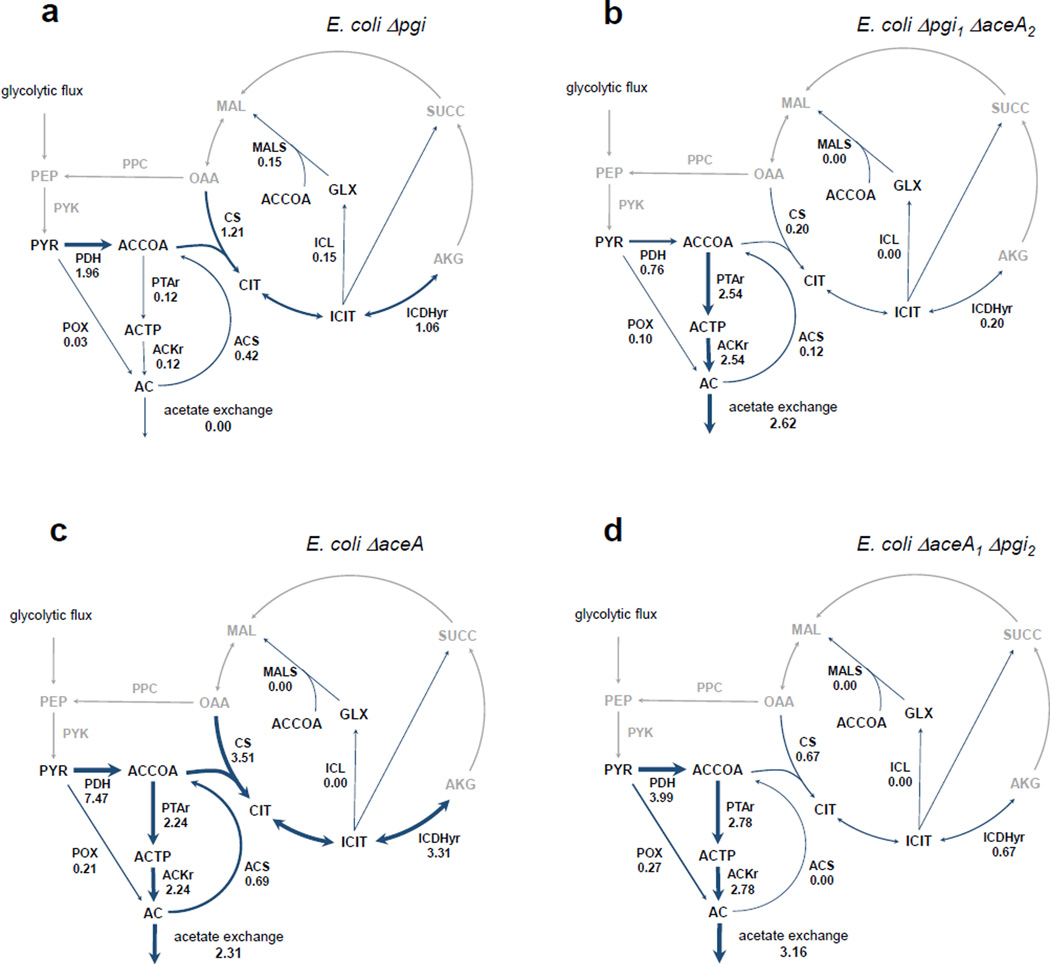
Fig. 3.
One plausible flux distribution obtained from RELATCH for the mutants a) E. coli Δpgi, b) E. coli Δpgi1 ΔaceA2, c) E. coli ΔaceA, and d) E. coli ΔaceA1 Δpgi2. The flux values are indicated beside the respective reactions and expressed in mmol/g dry cell weight/h. The nomenclature used for the reactions is from the genome-scale model iAF1260.26 The arrows represent the directions of the fluxes rather than the reversibility of the reactions.

