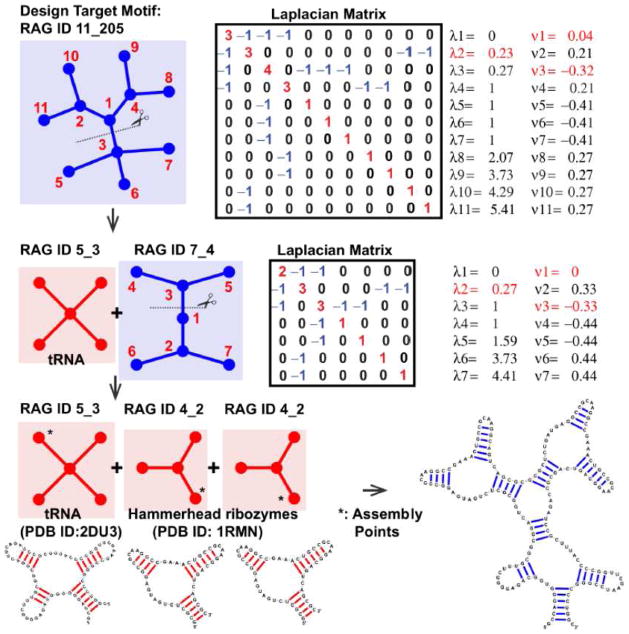
Figure 6. Design application for RNA-like topologies (example target: RAG ID 11_205).
The design procedures using graph partitioning and build-up approaches are shown. In the first row, graph 11_205 (with random vertex numbering), corresponding Laplacian matrix, eigenvalues (λ2 in red), and the second eigenvector (μ2) are shown. The largest gap of the sorted elements of μ2 (vertices 1 and 3) is marked in red. In the second row, two subgraphs (existing graph 5_3 and RNA-like graph 7_4) and gap cut analysis of RNA-like graph 7_4 are shown. The third row shows the assembly procedure: the build-up of three existing modules at the assembly points suggested by gap partitioning produce a candidate RNA with the targeted graph 11_205.

