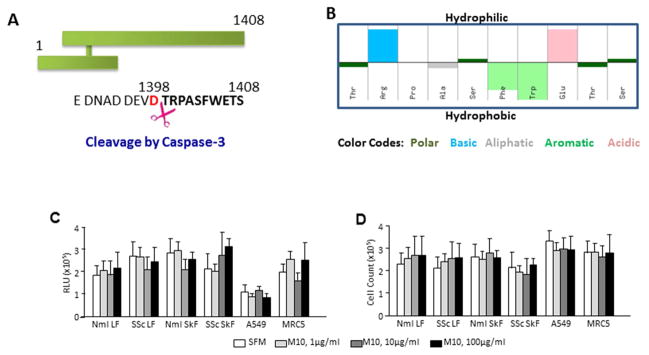
Figure 1. Basic properties of M10 peptide.
A, Position of M10 on the MET receptor tyrosine kinase. Cleavage site of caspase 3 is indicated by scissors. B, Hydropathy plot of M10 is prepared by the Hopp–Woods hydrophilicity scale. Hydrophilic residues are presented as upward bars and hydrophobic residues are presented as downward bars. C and D, M10 does not affect cell viability measured by the ATP-dependent assay (C) and by trypan blue cell counting (D).

