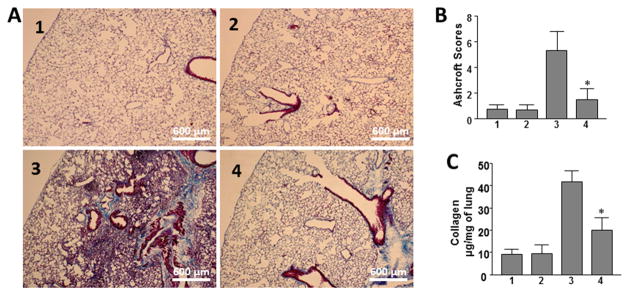
Figure 7. Effect of M10 on bleomycin-induced pulmonary fibrosis.
A. Representative histological findings of lung inflammation and fibrosis. 1 – control 1 (saline + scrambled peptide), 2 – control 2 (saline + M10), 3 bleomycin + scrambled peptide, 4 – bleomycin + M10. B. Quantitative evaluation of fibrotic changes (Ashcroft scores), n = 32 (eight mice per group). C. Lung collagen content determined by Sircol assay, n = 24 (six mice per group). Values in B and C are the mean ± SD. *statistically significant differences (P < 0.05) between bleomycin challenged mice treated with M10 and scrambled peptide.

