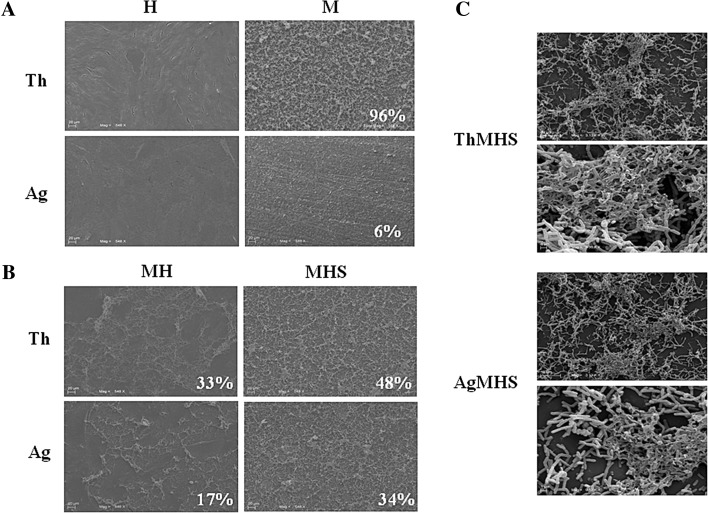
Fig. 2.
Scanning electron microscopy (SEM) on HGFs and HGFs/S. mitis co-culture in the presence of Chitlac and Chitlac-nAg thermosets. a Representative images of HGFs (H), S. mitis (M) and b HGFs in the presence of S. mitis and/or saliva (MH, MHS) cultured on Chitlac (Th) and Chitlac-nAg (Ag) thermosets (magnification ×548). Percentages indicate the densitometries of bacteria observed onto thermosets. c Representative images of S. mitis biofilm on Chitlac (ThMHS) and Chitlac-nAg thermosets (AgMHS). Magnification ×31300 (a, c), ×93600 (b, d). For abbreviation see Sect. 2

