
Fig. 2.
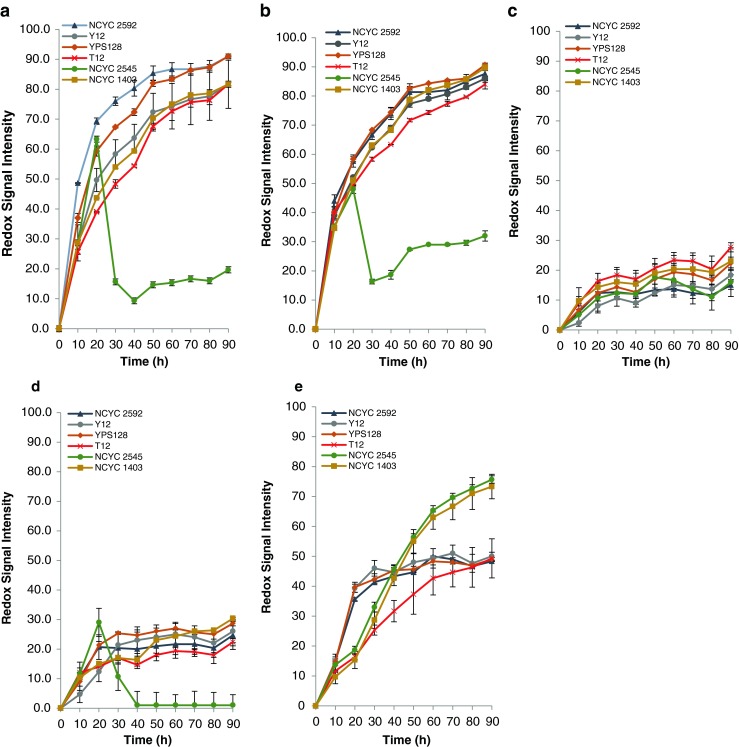
Phenotypic microarray analysis (redox signal intensity) for yeast on a L. digitata hydrolyste, b F. serratus hydrolysate, c C. crispus hydrolysate, d P. palmata hydrolysate, e U. lactuca hydrolysate. Data are the mean ± SD of three replicates. See Table 1 for description of yeast strains