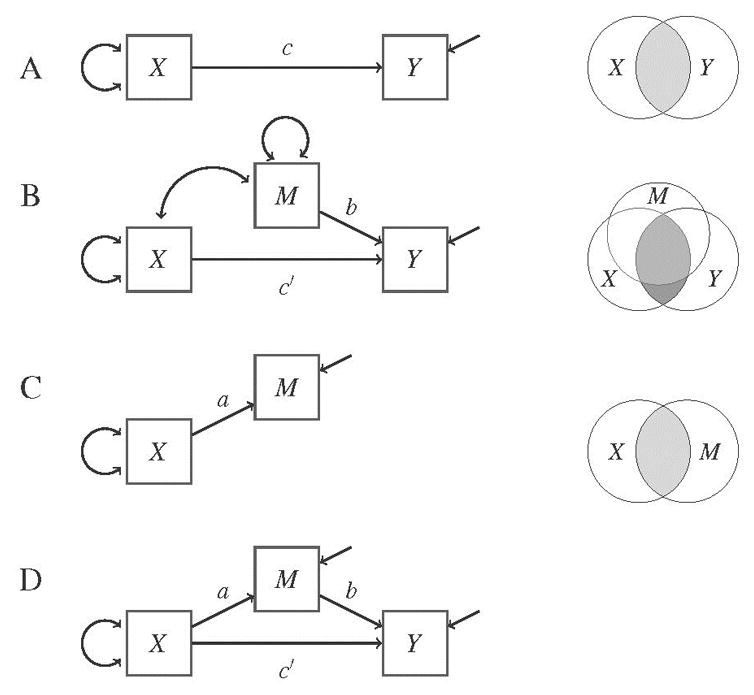
Figure 1.

Four sets of diagrams depicting concepts in mediation. Diagrams on the left are path diagrams with letters a, b, c and c′ representing standardized coefficients. Diagrams on the right are Venn diagrams where the shaded areas between circles relate to shared variances among the variables. Endogenous variables with arrows pointing towards them are dependent variables and exogenous variables with arrow emerging from them are independent variables.
