FIGURE 3.

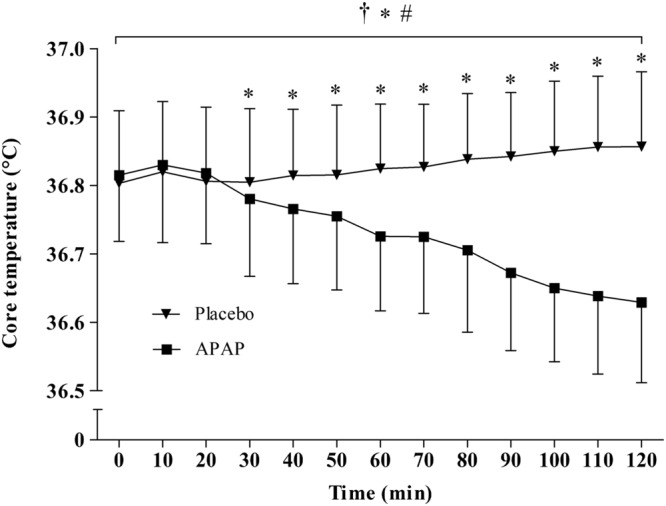
Mean ± standard deviation values for core temperature (TC) in both the APAP and placebo conditions. ∗Significant main effect for condition. #Significant main effect for time. †Significant interaction effect.

Mean ± standard deviation values for core temperature (TC) in both the APAP and placebo conditions. ∗Significant main effect for condition. #Significant main effect for time. †Significant interaction effect.