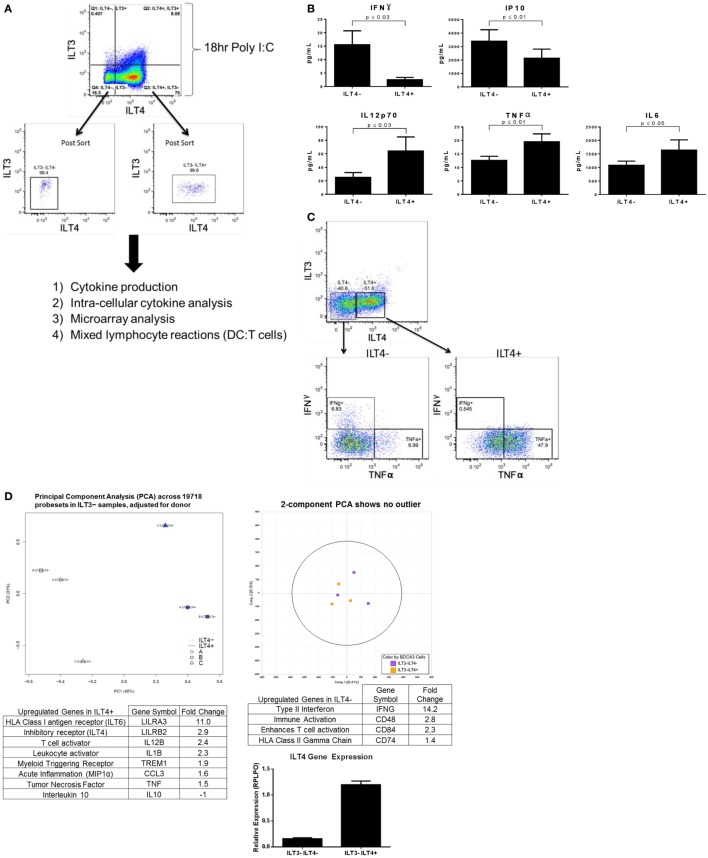
Figure 2.
Poly I:C-stimulated ILT4− and ILT4+ BDCA-3 cDCs have unique cytokine and gene signatures. (A) Experimental design of BDCA-3 DC phenotyping. (B) BDCA-3 cDCs were cultured with Poly I:C for 18 h and then sorted into ILT4− and ILT4+ populations. Cells were then plated without further stimulation for 18 h. Supernatants were assayed for cytokine and chemokine content by luminex analysis. P-values generated using two-tailed student’s paired t-test (95% confidence interval). Graphs represent four donors. (C) BDCA-3 cDCs were stimulated with Poly I:C for 18 h, Golgistop was then added for 6 h. Cells were surface stained with ILT3, ILT4, and CD141 and then intracellularly stained with IFN-γ and TNF-α. Data showing intracellular staining are representative of one donor out of four. (D) Genomic profiling of ILT4− vs. ILT4+ was performed using GeneChip Human Gene 1.0 ST arrays. Principal component analysis (PCA) was computed using OmicSoft ArrayStudio, and a plot was generated to show the relative clustering of ILT4− and ILT4+. ILT4− and ILT4+ populations were compared to each other by t-test with a threshold set for a fold change >1.5 and a P-value <0.05. ILT4 gene expression was confirmed by qPCR. (Data shown are one representative donor out of four).

