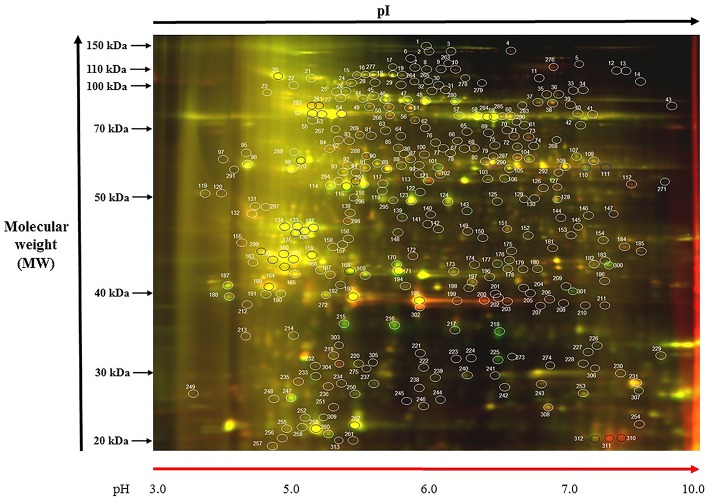
Figure 1.
Representative gel image: (A1/C7). Protein samples of SG and PCG leaves, control and treatment samples, were labeled with Cy3 (green) and Cy5 (red), respectively, and mixed in equal ratios. The first-dimension isoelectric points (pI, ranges from 3 to 10) and second-dimension molecular mass (in kDa and ranges from 20 to 150 kDa) are noted. Color coding: green spots indicate protein abundance is high in Cy3, red spots indicate protein abundance is high in Cy5, yellow spots indicates where protein abundance is similar in both the cases.

