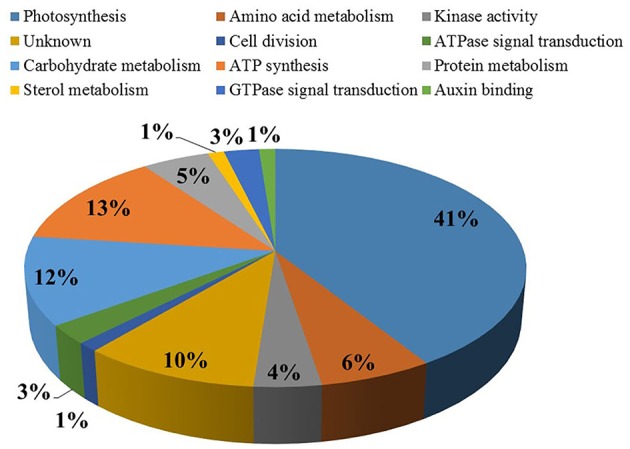
Figure 4.

Differentially abundant proteins, from the eight different comparisons in Figure 2, were categorized based on their Gene Ontology annotations. The most abundant ontologies are shown. Percentage value symbolize abundance of proteins in each functional class.
