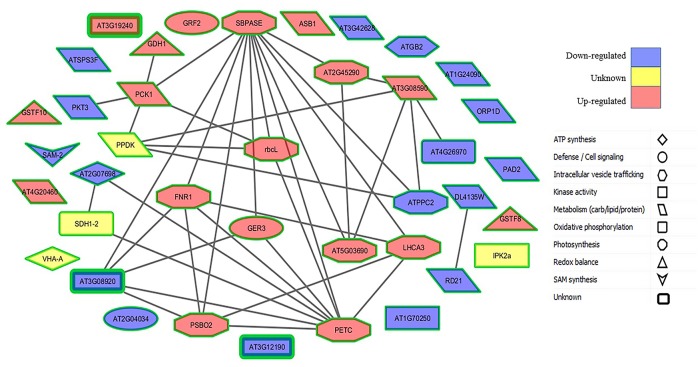
Figure 8.
Protein-protein interaction map for Arabidopsis homologs of differentially abundant proteins observed for LS PCG to ES PCG (G/E) before the onset of senescence. Red nodes represent proteins which had consistent higher abundance in LS PCG, blue nodes represent proteins with lower abundance, and yellow nodes represent proteins whose fold change in abundance was not significant.

