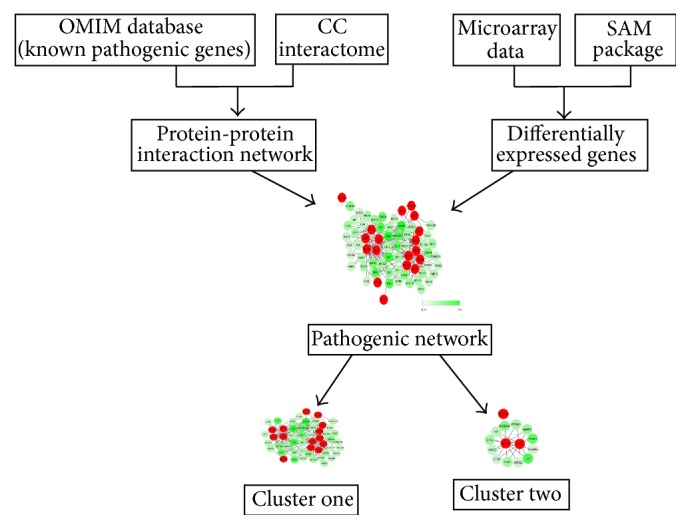
Figure 1.

The flow diagram of a network strategy to predict pathogenic genes. First of all, the differentially expressed genes were identified. Then, a pathogenic network was extracted. After that, differentially expressed genes were aligned to the network by interacting with at least two seed genes. Subsequently, the clusters composed of genes closely interacting with each other were screened, and the genes in the clusters are thought to be more possibly to be pathogenic genes.
