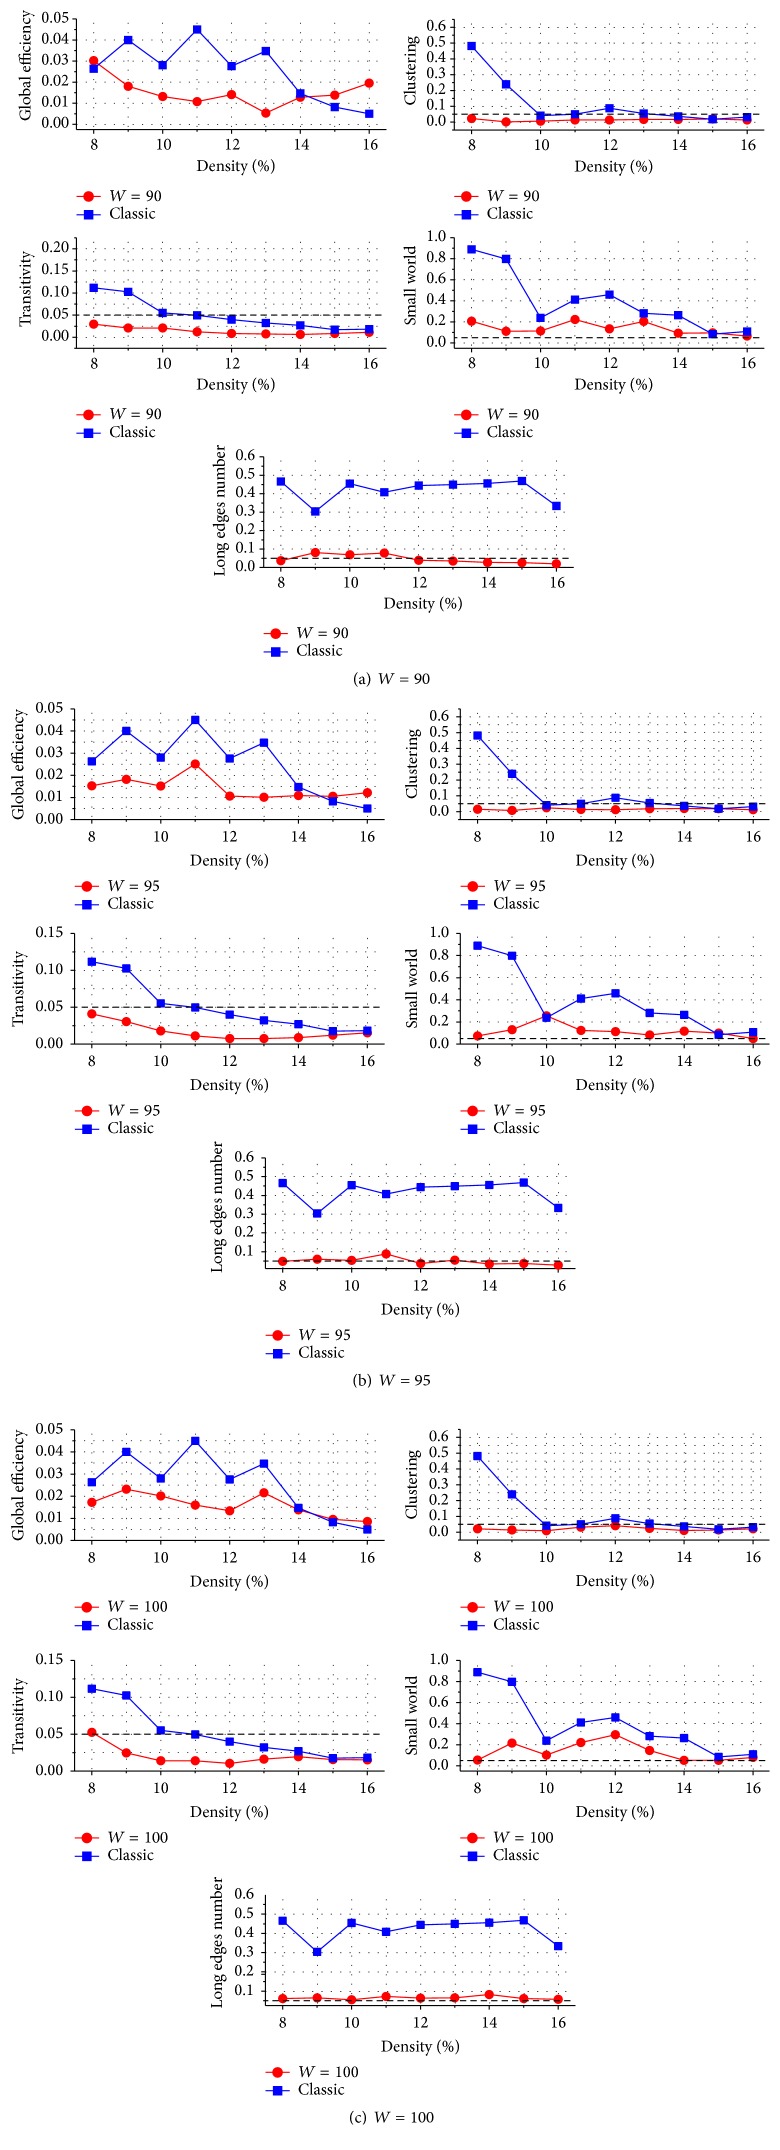
Figure 4.
Statistical analysis of topological properties of the networks produced using the SNV (W = 90, 95, and 100) and classic methods. The blue and red lines represent P values obtained through the classic and SNV methods, respectively. Compared with that of the networks constructed by the classic method, P values of topological properties of the networks constructed by the SNV method significantly decreased (permutation test, P < 0.05 in efficiency, P < 0.01 in other properties).

