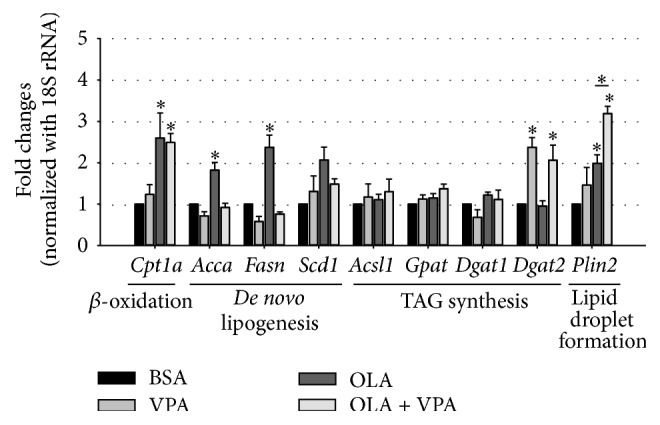
Figure 3.

Regulation of expression of lipid metabolism-related genes by OLA and VPA. The mRNA levels of lipid catabolism/anabolism-related genes including Cpt1, Acca, Fasn, Scd1, Acsl1, Gpat, Dgat1, Dgat2, and Plin2 in FL83B cells treated with BSA, 100 μM OLA, 1 mM VPA, or 100 μM OLA plus 1 mM VPA for 24 hours were analyzed using real-time PCR. Relative fold changes were calculated using Ct values obtained from three independent experiments and are shown as means ± SEM. ∗ above the bars refer to significant differences (P < 0.05).
