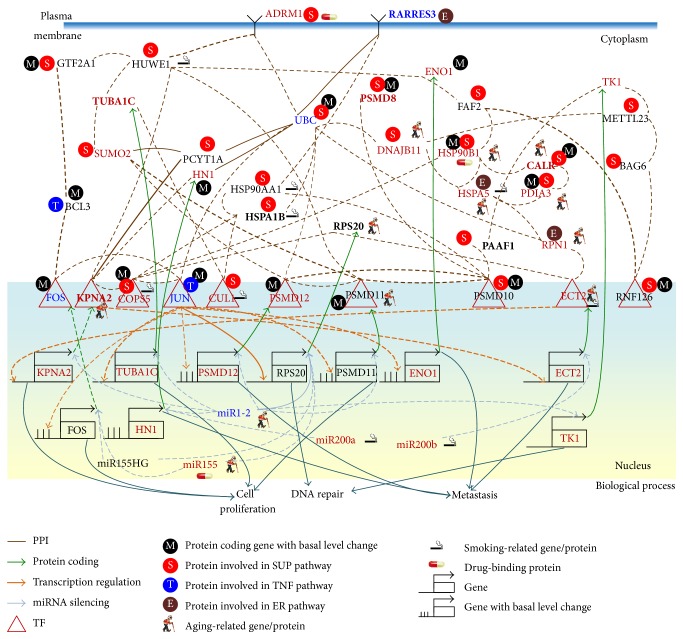
Figure 3.
Comparison of genetic and epigenetic alterations and connection changes in the core network biomarkers of bladder carcinogenesis between normal bladder cells and stage 1 bladder cancer cells. Red, blue, and black gene/miRNA symbols represent the highly expressed genes, the suppressed genes, and the nondifferentially expressed genes in stage 1 bladder cancer cells, respectively, compared with normal bladder cells. Dashed and solid lines denote the identified connections in normal and cancerous cells, respectively. The identified connections of the core network biomarkers do not exist in normal bladder cells only. Bold lines indicate the high regulatory or interaction parameters, that is, a ij, c li, and d jk, identified in the stochastic regression models (1)–(3) of the IGEN. The bold proteins, including RARRES3, TUBA1C, PSMD8, HSPA1B, RPS20, CALR, PAAF1, and KPNA2, were the identified core network biomarkers. The major factors, including downregulated miR1-2, the aging-related proteins, HSP90B1, CALR, HSPA5, PDIA3, RPN1, and ECT2, the smoking-related proteins, HUWE1, HSPA5, and ECT2, and the epigenetic regulation of ENO1, HSP90B1, CALR, and PDIA3, lead to the progression from normal bladder cells to stage 1 bladder cancer cells through the SUP and ER signaling pathways.

