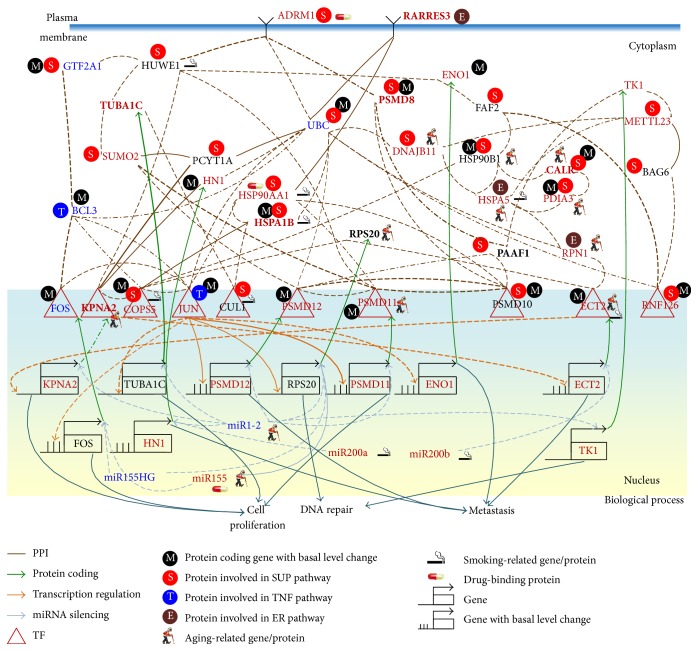
Figure 4.
Comparison of genetic and epigenetic alterations and connection changes in the core network biomarkers of bladder carcinogenesis between stage 1 and stage 4 bladder cancer cells. Red, blue, and black gene/miRNA symbols represent the highly expressed genes, the suppressed genes, and the nondifferentially expressed genes in stage 4 bladder cancer cells, respectively, compared with stage 1 bladder cancer cells. Dashed, dash-dot, and solid lines denote the identified connections in stage 1 cancer cells, stage 4 cancer cells, and both stage 1 and 4 cancer cells, respectively. Bold lines indicate the high regulatory or interaction parameters, that is, a ij, c li, and d jk, identified in the stochastic regression models (1)–(3) of the IGEN. The bold proteins RARRES3, TUBA1C, PSMD8, HSPA1B, RPS20, CALR, PAAF1, and KPNA2 were the identified core network biomarkers. The smoking-related protein HSP90AA1 and DNA methylation of ECT2 mediate metastasis of bladder cancer.

